A simple analysis of a Twitter dataset
I was given an assignment in class to analyze some Twitter data. Here is the prompt from the assignment:
1. Use your developer account to extract Joe Biden’s tweets in last three months
2. Analyze the tweet data
   1. Most likes
   2. Most retweets
   3. Most replied
   4. What are the hashtags in above messages
3. Collect a bag of hashtags for the following topics
   1. Black Lives Matter
   2. PLA Taiwan
   3. COVID vaccines
Below is what I did for this assignment. I started by installing a bunch of packages I needed. Then I authenticated the Twitter developer account I had created.
#Installing packages
ptbu=c("rtweet", "dplyr", "tidyverse","tidytext",  "data.table", "maps", "syuzhet","lubridate", "tm")
install.packages(ptbu)
lapply(ptbu, require, character.only = TRUE)

#Simple authentication!
auth_setup_default()
After that I extracted all of Joe Biden’s tweets from 1 Aug 2022 till the date I had pulled the data (Nov 1, 2022). So three months of Joe Biden’s tweets as was mentioned in the prompt 2.
#Getting Biden's timeline (i.e what he has tweeted)
biden_tweets <- get_timeline("939091", n = 500)
#Filtering to last 3 months' tweets alone
biden_3tweets <- biden_tweets %>% filter(created_at > '2022-08-01') #Getting last 3 months tweets
Then I sorted the tweets by favorite_count in descending order
#Most favorited
biden_3tweets_favs <- biden_3tweets[order(biden_3tweets$favorite_count, decreasing=T),][c("text", "created_at", "favorite_count")]
biden_3tweets_favs[1, "id_str"][[1]]
From this the most favorited tweet in my dataset turned out to be this one:
Donald Trump and MAGA Republicans are a threat to the very soul of this country.
— Joe Biden (@JoeBiden) September 2, 2022
Then I sorted the tweets by retweet_count in descending order
#Most retweets
biden_3tweets_rts <- biden_3tweets[order(biden_3tweets$retweet_count, decreasing=T),][c("text", "created_at", "retweet_count")]
biden_3tweets_rts[1, "id_str"][[1]]
From this the most retweeted tweet in my dataset turned out to be this one:
As I’ve said before, no one should be in jail just for using or possessing marijuana.
— President Biden (@POTUS) October 6, 2022
Today, I’m taking steps to end our failed approach. Allow me to lay them out.
I tried to repeat this same exercise with reply_count but the dataset just had NA in the entire column. I am unsure why the Twitter API responded with nothing in this column. This is a good example of the unreliability of API methods - you are always at the mercy of whichever organizations controls that API!
Then I tried to obtain hashtags from these tweets.
lapply(head(biden_3tweets_favs, 50)['text'], function(elt) str_extract(elt, regex('#[a-zA-Z0-9_]+')))
To my surprise I got nothing. I checked Joe Biden’s twitter timeline and saw that he never uses hashtags! I am not sure why this is the case. Anyways, with that prompt 2 is done. Moving on to prompt 3…
For prompt 1, I pulled the timeline of a specific user. Now I need to pull tweets based on the keywords provided.
#Pulling tweets
blm <- rtweet::search_tweets(q = "Black Lives Matter", n = 5000, lang = "en", retryonratelimit = TRUE)
pla <- rtweet::search_tweets(q = "PLA Taiwan", n = 5000, lang = "en", retryonratelimit = TRUE)
covid <- rtweet::search_tweets(q = "COVID vaccines", n = 5000, lang = "en", retryonratelimit = TRUE)
Now, to pull hashtags from these datasets, I created a function that uses regexp to extract anything that starts with a pound sign (or octothorpe if you want to sound cool!). The function also cleans things up and returns a tidy vector of hashtags. I proceeded to call the function on my datasets.
#Bag of hashtags
hashtag_extractor <- function (tweets) {
  hashtags <- lapply(tweets, function(tweet) str_extract_all(tweet, regex('#[a-zA-Z0-9_]+')))
  hashtags <- unlist(hashtags, use.names = F, recursive = TRUE)
  hashtags <- hashtags[!is.na(hashtags)]
  return(hashtags)
}

blm_hashtags <- hashtag_extractor(blm['text'])
pla_hashtags <- hashtag_extractor(pla['text'])
covid_hashtags <- hashtag_extractor(covid['text'])
Now I needed a way to visualize these hashtags. So, like last time, I proceeded to create word clouds.
#Word clouds of hashtags
library(easypackages)
packages("wordcloud","RColorBrewer","NLP","tm","quanteda", prompt = T)

cloud_gen <- function(docs){
  words.vec <- VectorSource(docs)
  words.corpus <- Corpus(words.vec)

  tdm <- TermDocumentMatrix(words.corpus)
  m <- as.matrix(tdm)
  wordCounts <- rowSums(m)
  wordCounts <- sort(wordCounts, decreasing=TRUE)

  cloudFrame<-data.frame(word=names(wordCounts),freq=wordCounts)
  set.seed(1234)
  wordcloud(names(wordCounts),wordCounts, min.freq=3,random.order=FALSE, max.words=500,scale=c(3,.5), rot.per=0.35,colors=brewer.pal(8,"Dark2"))
}

cloud_gen(blm_hashtags)
cloud_gen(pla_hashtags)
cloud_gen(covid_hashtags)
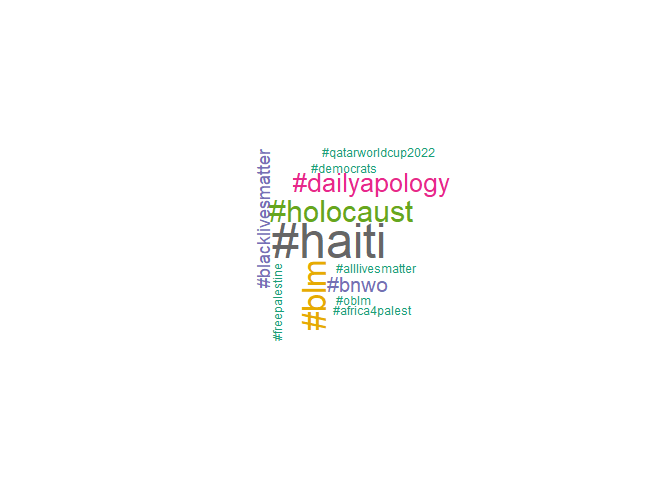
You can see the results below. From the “Black Lives Matter” tweets:

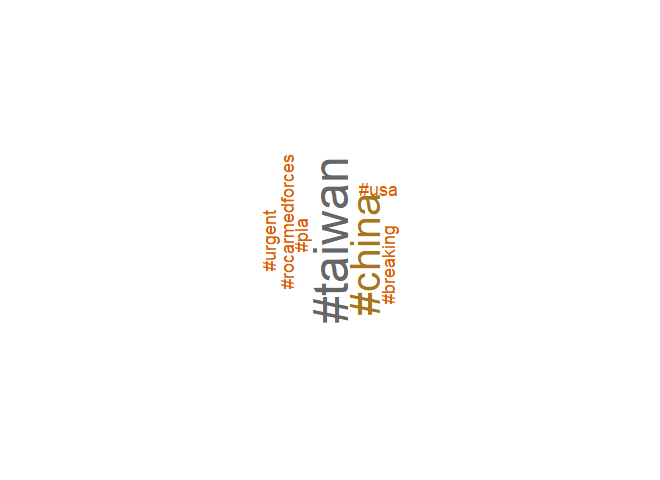
From the “PLA Taiwan” tweets:

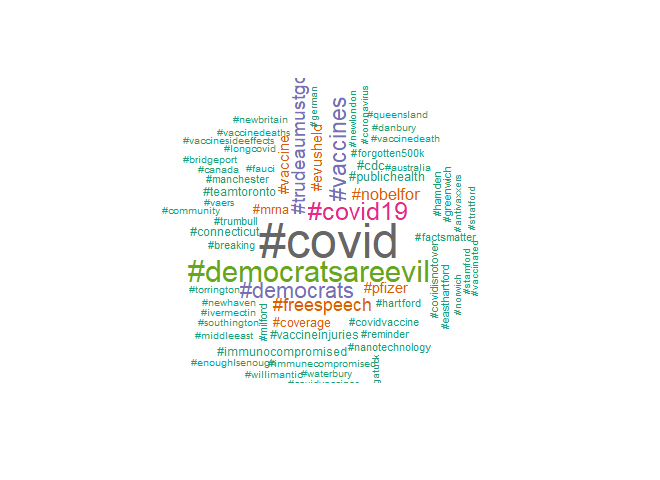
From the “COVID vaccines” tweets:
